Imagine relying on solar power during a blackout or running your laptop from a car battery while off-grid, only to find your battery draining faster than expected. The culprit is power inverter efficiency, a hidden factor that determines how much of your stored DC energy actually powers your devices versus how much vanishes as heat. Understanding this metric is essential for anyone building solar systems, RVs, boats, or backup power setups.
Power inverter efficiency measures how well an inverter converts direct current from batteries into usable alternating current for your appliances. It’s calculated as the ratio of AC output power to DC input power, expressed as a percentage. No inverter achieves 100% efficiency, and modern units range from 85% to 98% peak efficiency. This guide covers what affects efficiency, how to measure it, and why it matters for your specific application.
How Inverter Efficiency Is Measured

Inverter efficiency isn’t a single number that tells the whole story. Manufacturers present efficiency in different ways, and understanding these differences helps you choose the right unit for your needs.
Peak vs Weighted Efficiency
Peak efficiency represents best-case performance, typically achieved at full load under ideal conditions. This number appears prominently on spec sheets and can reach 85% to 98% for quality inverters. However, peak efficiency rarely reflects how your inverter performs in daily use.
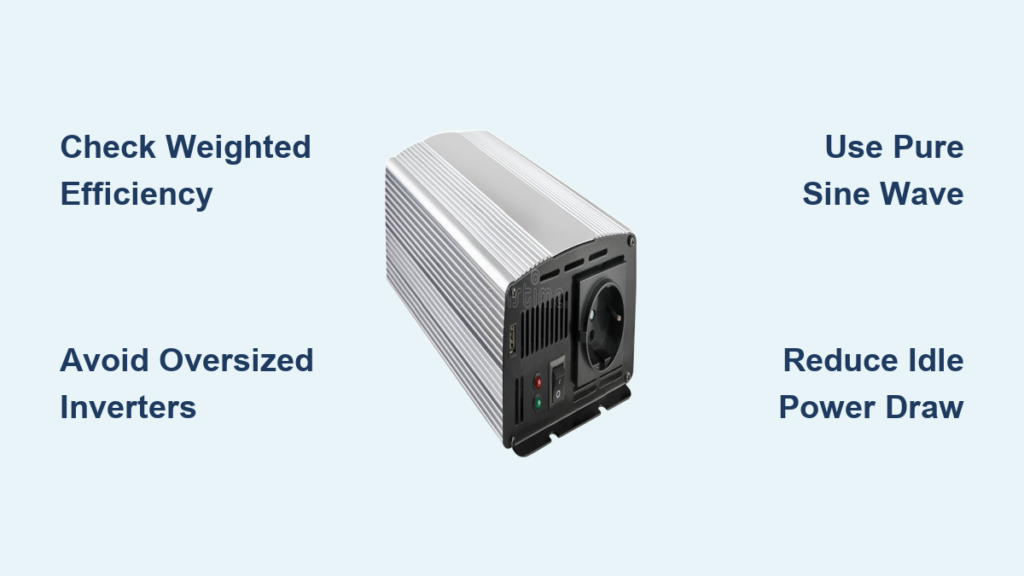
Weighted efficiency provides a more realistic picture by averaging performance across common load levels. The California Energy Commission formula weights efficiency at different percentages of rated capacity, giving you a figure that better predicts actual runtime. For system planning, always use weighted efficiency rather than peak efficiency.
Reading Efficiency Curves
Manufacturer efficiency curves graph performance across various load levels. When evaluating these graphs, look for curves that start at 0W or 10W rather than 100W, as truncated graphs hide poor low-load performance. Check efficiency at 25%, 50%, and 75% load to understand how your inverter performs under typical conditions.
A 3000W inverter might show 95% efficiency at full power but drop to 65% when running a 50W laptop. This dramatic falloff happens because fixed internal power use becomes significant relative to small outputs.
Key Factors That Affect Efficiency
Several variables influence how efficiently your inverter operates. Understanding these factors helps you optimize your entire power system.
Load Level and Operating Range
Efficiency varies dramatically with load. At 10% to 25% of rated capacity, efficiency drops to 65% to 75% because fixed internal power consumption dominates the energy balance. At 50% to 100% load, efficiency peaks at 85% to 98% depending on the design. Even with no load connected, inverters consume power to stay operational.
Running small devices on oversized inverters wastes significant energy. A 50W load on a 3000W inverter may achieve less than 70% efficiency, while the same 50W load on a 400W inverter performs far better.
Inverter Type and Waveform Quality
The AC waveform an inverter produces impacts both device compatibility and energy loss. Pure sine wave inverters deliver smooth output with less than 3% total harmonic distortion, achieving 90% to 98% efficiency and protecting motors, electronics, and medical equipment. Modified sine wave inverters produce a stepped waveform with about 30% distortion, causing 10% to 20% efficiency loss in motors and transformers while generating excess heat. Square wave inverters, rarely used today, produce about 48% distortion and are incompatible with most modern electronics.
Component Design and Topology
High-efficiency inverters use advanced components to minimize losses. Low-resistance MOSFETs and IGBTs reduce switching losses. H-bridge and multilevel topologies improve waveform quality while reducing harmonic losses. High-quality transformers and inductors minimize core and copper losses. Efficient cooling systems prevent thermal throttling that degrades performance.
Temperature and Ventilation
Heat is the enemy of efficiency. Most inverters begin derating above 40°C and may shut down entirely to protect components. Poor ventilation traps heat, increasing internal resistance and power loss. Install inverters in cool, shaded, well-ventilated areas away from heat sources like engines or batteries. Dust buildup on heatsinks can reduce cooling performance by up to 30%.
Idle and Standby Power Draw
Inverters consume power even when no loads are connected. Idle consumption ranges from 15W to 50W for residential models. Quiescent standby draw at 12V ranges from 0.6A to 2.24A, which translates to 14.4Ah to 53.8Ah per day. For seasonal or low-usage systems, this phantom load often represents the biggest energy drain, potentially depleting a battery in days without any actual loads running.
Real-World Efficiency Case Studies
The Double Conversion Penalty
Many devices like laptops, phones, and TVs run internally on DC. When powered through an inverter, they undergo double conversion: battery DC becomes inverter AC, then the device’s adapter converts it back to DC. Each step loses energy, with inverter loss at 10% to 20% and wall-wart loss at 10% to 25%, totaling 30% to 50% system loss.
A test with a 12V LCD TV demonstrated this problem clearly. Direct DC operation drew 3.9A (46.8W). Running through a 2000W inverter plus wall-wart drew 5.8A (69.6W), representing 48.7% more power consumption. Using a smaller 400W inverter reduced the draw to 5.2A (62.4W), cutting losses by approximately 25%.
Measuring True System Efficiency
To calculate actual efficiency in your system, start by measuring baseline idle draw with no AC load connected. Subtract this baseline from all subsequent readings. Test under real loads across different power levels, then calculate weighted average efficiency using your actual measurements rather than manufacturer claims.
Why Efficiency Matters in Key Applications
Solar Power Systems
In solar installations, every watt counts toward your return on investment. A 95% efficient inverter delivers 95kWh from 100kWh of solar input. An 85% efficient unit wastes 15kWh, equivalent to losing 15% of your solar production. Over years, this difference translates to thousands of dollars in lost energy value.
Electric Vehicles and Motor Drives
EVs rely on inverters to convert battery DC into variable-frequency AC for motor control. High-efficiency inverters directly extend driving range. Regenerative braking systems use bidirectional inverters to recover energy during deceleration. Variable refrigerant flow HVAC systems use inverter-driven compressors to achieve 30% to 50% energy savings.
UPS and Backup Power
In data centers and medical facilities, UPS systems depend on inverters for seamless power during outages. A 90% efficient 5kVA unit wastes 500W as heat, requiring additional cooling infrastructure. High idle draw reduces available battery backup time when outages occur.
Grid and Industrial Use
HVDC transmission systems use massive inverters to convert DC back to AC at receiving stations. Grid-tied inverters must meet IEEE 519 standards for harmonic distortion and safely disconnect during blackouts. Even small efficiency gains at this scale save megawatts of energy.
How to Maximize Inverter Efficiency
Choose the Right Size and Type
Select an inverter sized for your typical load, targeting 50% to 75% capacity usage for optimal efficiency. Avoid oversized inverters for small, intermittent loads. Choose pure sine wave models for motors, electronics, and sensitive equipment.
Reduce Conversion Stages
Eliminate double conversion whenever possible. Use DC-powered devices like 12V LED lights, DC refrigerators, and USB chargers directly. Replace AC adapters with DC-DC converters where feasible. Install DC pumps, fans, and compressors to bypass inverter losses entirely.
Optimize Installation and Environment
Place inverters in cool, dry, ventilated locations. Use short, thick cables to reduce voltage drop. Keep vents and heatsinks dust-free. Avoid daisy-chained connections or undersized wiring, which can improve system efficiency by 3% to 5%.
Use Smart Features Wisely
Enable load-sensing auto on/off to reduce idle draw. Be aware of startup thresholds, typically 10W to 15W, which may prevent small devices from triggering the inverter. Use always-on mode only when essential, as it increases 24/7 power consumption.
Maintain and Monitor Performance
Inspect terminals for looseness or corrosion regularly. Clean cooling fins every 6 to 12 months. Update firmware when available, as new algorithms often improve efficiency. Track battery drain over time to detect performance degradation.
Technical Benchmarks and Specifications

Understanding key specifications helps you evaluate inverters objectively.
| Parameter | Typical Range | Why It Matters |
|---|---|---|
| Peak Efficiency | 85% to 98% | Best-case performance at full load |
| Weighted Efficiency | 90% to 97% | Real-world average for planning |
| Idle Power | 15W to 50W | Drains battery even when idle |
| Quiescent Draw | 0.6A to 2.24A at 12V | Critical for long-term battery health |
| THD (Pure Sine) | Less than 3% | Safe for all electronics |
| THD (Modified Sine) | About 30% | Causes inefficiency in motors |
| Surge Capacity | 2 to 8 times rating | Needed for motor startup |
| Operating Temperature | -10°C to 40°C | Derating occurs above 40°C |
Safety and Certification Standards
Ensure your inverter meets relevant safety standards for your application. UL 458 is required for marine and mobile inverters. Supplement SA adds marine-specific requirements for corrosion resistance and ventilation. ABYC A31.5.3.2 mandates UL 458 compliance for boat installations. Look for CSA, ETL, or TÜV certifications for additional safety verification.
For marine and RV applications, choose UL-listed marine inverters from trusted manufacturers like Victron, Magnum, or Mastervolt. These units are specifically designed to handle humidity, vibration, and salt exposure.
Frequently Asked Questions About Power Inverter Efficiency
What is a good efficiency rating for a power inverter?
A good weighted efficiency rating for real-world use ranges from 85% to 95%. Peak efficiency numbers above 90% are impressive, but focus on weighted or CEC efficiency for accurate system planning, as this reflects actual daily performance across varying loads.
Does inverter size affect efficiency?
Yes, inverter size significantly affects efficiency. Running small loads on oversized inverters wastes energy because fixed internal power consumption becomes a larger proportion of total power used. A 400W inverter running a 100W load typically outperforms a 2000W unit under identical conditions.
How much power does an inverter use when idle?
Inverters consume 15W to 50W when idle with no load connected. This varies by model and size. For battery-dependent systems, this idle draw can deplete batteries in days, making it a critical factor for seasonal or intermittent use applications.
Can I improve inverter efficiency through installation?
Yes, proper installation improves efficiency. Keep inverters cool and well-ventilated. Use short, thick cables to minimize voltage drop. Install away from heat sources. Keep cooling fins and vents clean from dust and debris. These measures can improve efficiency by 3% to 5%.
What’s the difference between pure sine wave and modified sine wave efficiency?
Pure sine wave inverters typically achieve 90% to 98% efficiency. Modified sine wave inverters lose 10% to 20% efficiency when powering motors and transformers due to harmonic distortion and waveform incompatibility. For sensitive electronics and inductive loads, pure sine wave is always more efficient.
How do I calculate real inverter efficiency for my system?
Measure DC input power and AC output power under your actual loads. Subtract baseline idle draw from DC input measurements. Test across multiple load levels typical of your usage. Calculate weighted average using your measured values rather than manufacturer specifications.
Key Takeaways for Optimizing Your Power System
Power inverter efficiency directly impacts battery runtime, energy costs, and system reliability across all applications. The difference between an 85% efficient and a 95% efficient inverter can mean the difference between your system running all night or dying at dusk.
Focus on weighted efficiency rather than peak efficiency when planning your system. Right-size your inverter to your typical load, choose pure sine wave for sensitive equipment, and account for idle draw when calculating battery capacity. Minimize double conversion stages by using DC-powered devices directly whenever possible.
For realistic planning, use a measured weighted efficiency around 84% as a conservative estimate. This accounts for the actual losses your system will experience rather than theoretical maximums. Measure your specific setup to confirm these numbers and adjust your battery sizing accordingly.
By understanding and optimizing inverter efficiency, you maximize usable power, extend battery life, and reduce energy waste whether you’re living off-grid, cruising, or preparing for power outages.